
WEB サイトの性能比較
Apache Bench を使ってWEBサイトの性能比較を行ってみました。
方法
ローカルのMac OS のターミナルからウエブサーバーに対して、Apache Bench で接続性能のテストを行う。
% ab -n <Total発行リクエスト数> -c <同時接続数> <URL>
1接続あたり1リクエストで同時接続が100の場合は、
% ab -n 100 -c 100 <URL>
というように書きます。
このサイトの評価
FreeBSD サーバー
ハードウエアは化石のようなスペック
CPU: Intel(R) Pentium(R) CPU G4560 @ 3.50GHz (3504.17-MHz K8-class CPU)
2 core(s) x 2 hardware threads
real memory = 17179869184 (16384 MB)
<WDC WD40EFAX-68JH4N1 83.00A83> ACS-3 ATA SATA 3.x device
Nginx Fast-CGI 有効の他、Web Serverとしてチューニング済み
					 % ab -n 1000 -c 100 https://ubuntu.wisdomx.jp/

This is ApacheBench, Version 2.3 <$Revision: 1901567 $>
Copyright 1996 Adam Twiss, Zeus Technology Ltd, http://www.zeustech.net/
Licensed to The Apache Software Foundation, http://www.apache.org/

Benchmarking ubuntu.wisdomx.jp (be patient)
Completed 100 requests
Completed 200 requests
Completed 300 requests
Completed 400 requests
Completed 500 requests
Completed 600 requests
Completed 700 requests
Completed 800 requests
Completed 900 requests
Completed 1000 requests
Finished 1000 requests


Server Software:        nginx
Server Hostname:        ubuntu.wisdomx.jp
Server Port:            443
SSL/TLS Protocol:       TLSv1.2,ECDHE-RSA-CHACHA20-POLY1305,2048,256
Server Temp Key:        ECDH X25519 253 bits
TLS Server Name:        ubuntu.wisdomx.jp

Document Path:          /
Document Length:        104066 bytes

Concurrency Level:      100
Time taken for tests:   4.025 seconds
Complete requests:      1000
Failed requests:        0
Total transferred:      104480000 bytes
HTML transferred:       104066000 bytes
Requests per second:    248.42 [#/sec] (mean)
Time per request:       402.538 [ms] (mean)
Time per request:       4.025 [ms] (mean, across all concurrent requests)
Transfer rate:          25346.99 [Kbytes/sec] received

Connection Times (ms)
              min  mean[+/-sd] median   max
Connect:        9   92  90.5     49     545
Processing:    52  287 188.6    216    1229
Waiting:        1   53  61.9     34     591
Total:         93  380 221.9    315    1450

Percentage of the requests served within a certain time (ms)
  50%    315
  66%    449
  75%    500
  80%    534
  90%    709
  95%    805
  98%    980
  99%   1049
 100%   1450 (longest request)
古いハードウエアなので、応答性は現代のPCの性能に全く歯が立ちません。
サーバーには、キャッシュ等のチューニングを行っているので、たくさんのアクセスがあった場合は、待ち時間が少なくなるので、性能の劣化は少ない。
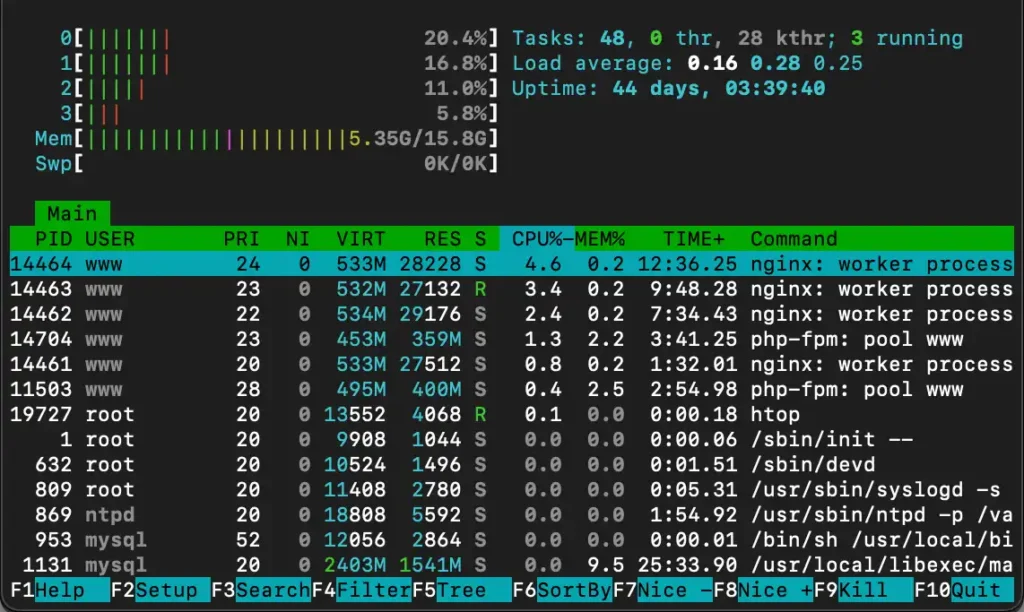
ページはキャッシュされているので、CPUの使用率は高くならない。
1000アクセスを処理するのに約4秒程度。
実験中のUbuntu LEMP キャッシュなし
ミニPC
AMD Ryzen7 3750H CPUコア 4 スレッド 8
メモリー DDR4 2400MHz NVMe M.2 SSD 使用
Nginx Fast-CGI 無効
					 % ab -n 1000 -c 100 http://dname.nh/

This is ApacheBench, Version 2.3 <$Revision: 1901567 $>
Copyright 1996 Adam Twiss, Zeus Technology Ltd, http://www.zeustech.net/
Licensed to The Apache Software Foundation, http://www.apache.org/

Benchmarking dname.nh (be patient)
Completed 100 requests
Completed 200 requests
Completed 300 requests
Completed 400 requests
Completed 500 requests
Completed 600 requests
Completed 700 requests
Completed 800 requests
Completed 900 requests
Completed 1000 requests
Finished 1000 requests


Server Software:        nginx/1.18.0
Server Hostname:        dname.nh
Server Port:            80

Document Path:          /
Document Length:        51828 bytes

Concurrency Level:      100
Time taken for tests:   14.728 seconds
Complete requests:      1000
Failed requests:        0
Total transferred:      52034000 bytes
HTML transferred:       51828000 bytes
Requests per second:    67.90 [#/sec] (mean)
Time per request:       1472.754 [ms] (mean)
Time per request:       14.728 [ms] (mean, across all concurrent requests)
Transfer rate:          3450.30 [Kbytes/sec] received

Connection Times (ms)
              min  mean[+/-sd] median   max
Connect:        0    1   0.9      0       5
Processing:    59 1392 226.5   1443    1668
Waiting:       58 1391 226.5   1441    1666
Total:         64 1393 225.8   1443    1669
WARNING: The median and mean for the initial connection time are not within a normal deviation
        These results are probably not that reliable.

Percentage of the requests served within a certain time (ms)
  50%   1443
  66%   1459
  75%   1472
  80%   1479
  90%   1494
  95%   1513
  98%   1575
  99%   1611
 100%   1669 (longest request)
ハードウエアの性能が高いので、応答性能は高い。
キャッシュの設定がされていないので、同時アクセスの場合、待ち時間が発生して、どんどん遅くなると考えます。
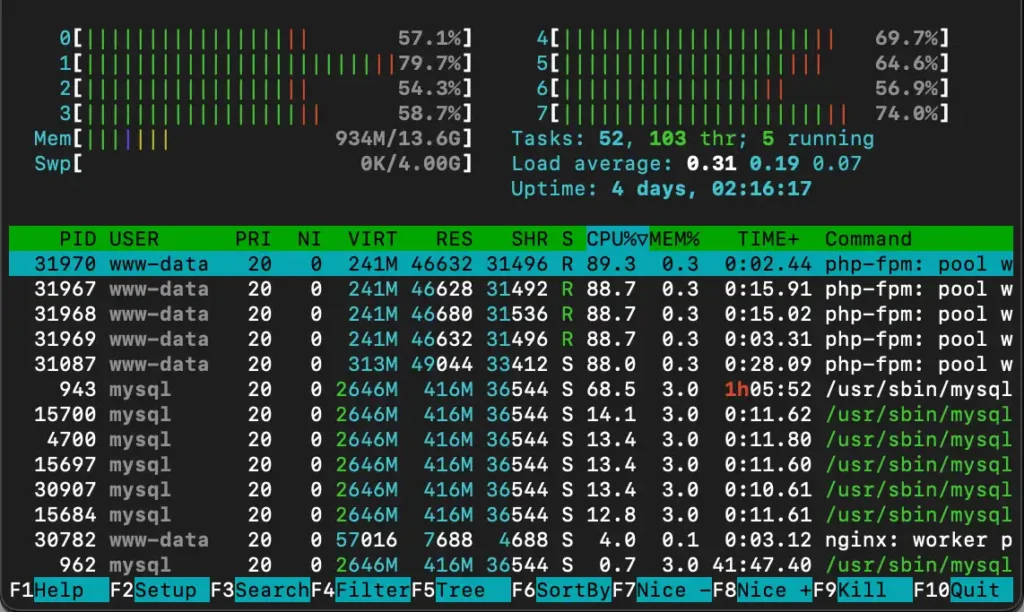
同時 100 アクセスすると CPU の使用率は高い。
1000アクセスを処理するのに約13.7秒程度を要する。
実行結果の見方
リクエストは全部正常に処理されたか?
Complete requests/Failed requests
完了したリクエストと失敗したリクエストの数を表示します。失敗したリクエストについては、理由の内訳(Connect, Receive, Length, Exceptions)が表示されますので、確認します。
失敗するリクエストが見られるときは、同時接続数の設定を見直します。また、動的に生成するページにアクセスしているときは、アプリケーションでページ生成系のエラーが出ていないか、ログを確認します。
秒間どれくらいのリクエストを捌けるのか?
Requests per second
1秒間に処理したリクエスト数の平均値(ミリ秒)です。
性能テストを実施するときは、この値が目標値の範囲に収まっているかを確認します。
パフォーマンス確認
Time per request(mean, across all concurrent requests)
1リクエストあたりの処理時間を確認します
コネクション時間
Connection Times
リクエストに要した時間(ミリ秒)の内訳です。Connect, Processing, Waitingの最小値、最大値、平均値と標準偏差、中央値を示します。
Connect: 接続確立までにかかった時間です
Waiting: 接続確立からクライアントがレスポンスを受け取るまでにかかった時間です。
Processing: 対象サーバ側での処理時間です。アプリケーションで行う処理が複雑なときは、この値が大きくなる傾向があります
何リクエストまで耐えられるのか?
オプション -n -cを増していき、Failed requestsが0でなくなるのが限界点となります。